- Market for "output"
- The composition of various markets is unimportant
- Markets tend to move together
- Study problems such as inflation and unemployment
- Aggregate supply curve
- Aggregate demand curve
- Continuously-rising price level
- Occurs if the aggregate demand curve keeps shifting to the right
- Shift of aggregate supply?
- Decline in the economy's output
- Occurs if the aggregate demand curve shifts to the left
- Shift of aggregate supply
- Value of all final goods and services produced by the economy in a year
- Nominal GDP: Using current prices
- Real GDP: Corrected for inflation
- Does not measure welfare or success in development, by itself
- Basic indicators used by the World Bank
- Does not say whether it merely offsets some natural disaster
- Excludes non-market activities
- Does not account for environmental costs
- Short-run fluctuations in business activity
- Recession - Trough - Expansion - Peak
- The Great Depression (1929-1933): High unemployment
- World Wars I and II: High growth rate of GDP
- Stagflation (1973-1980): High unemployment and inflation
- The Reagan Years (1980-1988): Falling unemployment and inflation
- The booming 1990s
- A mild recession in 2001
- The Great Recession of 2008-09
GDP: Measure of Economic Activity

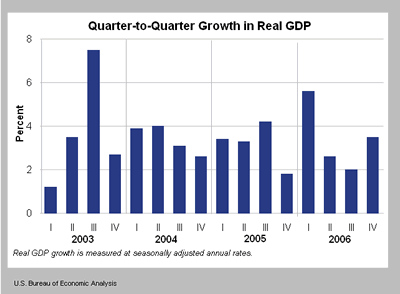
Gross Domestic Product (GDP) is the the broadest measure of economic activity. Annualized quarterly percent changes in GDP reflect the growth rate of total economic output. The figures can be quite volatile from quarter to quarter. Inventory and net export swings in particular can produce significant volatility in GDP. The final sales figure, which excludes inventories, can sometimes be helpful in identifying underlying growth trends as inventories represent unsold goods, and a large inventory increase will boost GDP but might be indicative of weakness rather than strength. The broad components of GDP are: consumption, investment, net exports, government purchases, and inventories. Consumption is by far the largest component, totalling roughly 2/3rds of GDP.
GDP Deflator
The GDP deflator measures the change in prices in total GDP and for each component. Though the consumer price index is a more closely watched inflation indicator, the GDP deflator is another key inflation measure. Unlike CPI, it has the advantage of not being a fixed basket of goods and services, so that changes in consumption patterns or the introduction of new goods and services will be reflected in the deflator.
With both GDP and the deflator, the market tends to focus on the quarter/quarter change. Year/year changes are also cited frequently, though they do not provide the most timely indications of economic activity or inflation. The bond market often reacts to GDP, though the price moves are typically small, as much of the GDP data is easily predicted using monthly economic releases such as personal consumption, durable goods shipments, construction spending, international trade, and inventories.
Quarterly GDP reports are broken down into three announcements: advance, preliminary, and final. After the final revision, GDP is not revised again until the annual benchmark revisions each July. These revisions can be quite large and usually affect the past five years of data.
Source: Yahoo Economic Calendar Terms
Data on GDP available at the Bureau of Economic Analysis.